Change Language :
Service life calculation thanks to the test laboratory
iglidur 3D-printed components on the test rig
3D printing polymers that, in moving parts, last up to 80 times as long as normal plastics and in some applications are more durable than metal.
Is that a pipe dream? No, those are the clear statistics provided by testing in our test laboratory and confirmed by our customers. Calculated, tested, proven: each statement about the service life of iglidur plastics for additive manufacturing is based on comparisons that have been performed many times. Their evaluation is also the data basis for our Long Life Calculator - which you can use to calculate the expected service life of your printed components in just a few clicks.
You can find these wear tests on this page:


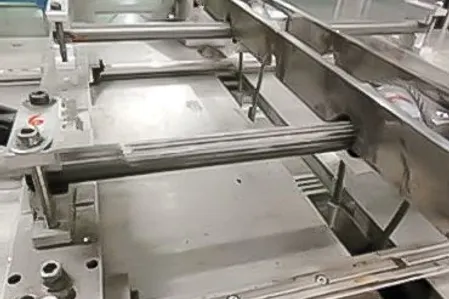
Wear test: Linear long stroke
3D printing materials in the test: Wear-resistant plastic iglidur i3 beats ABS material by a factor of 33
Test parameters:
- Surface pressure: 0.11MPa
- Surface speed: 0.34m/s
- Stroke: 370mm
- Running time: 3 weeks
Shaft materials: aluminium hc
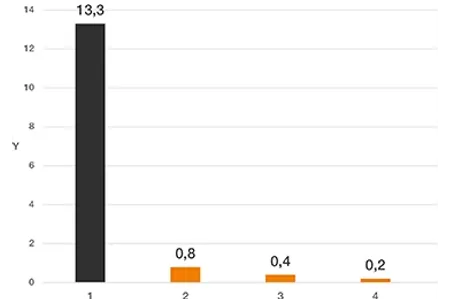
Y-axis: Wear rate [μm/km]
X-axis: Materials in the test
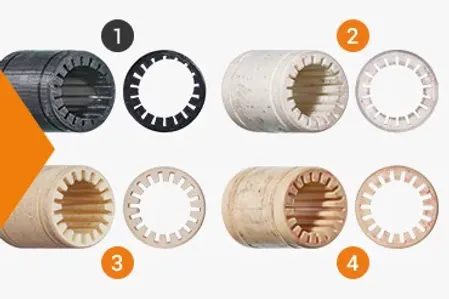
1. ABS (FDM 3D printing)
2. iglidur i180 (FDM 3D printing)
3. iglidur i3 (SLS 3D printing)
4. iglidur J (injection moulding)
Test result:
The long-stroke test shows 15 times lower wear values for iglidur i180 (FDM) and even 33 times lower values for iglidur i3 (SLS). Due to the very good tribological specifications, the wear-resistant iglidur materials are ideal for long-stroke applications, e.g. XY linear robots for pick & place applications or plain bearings and glide bars in the 3D printer.
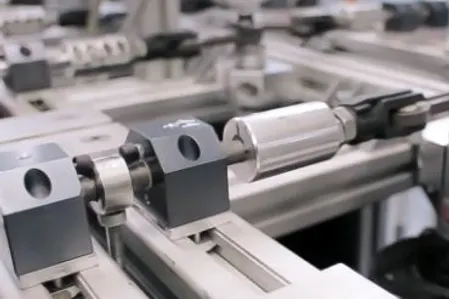
Wear test: Linear short stroke
Tribological specifications of plain bearings from 3D printing almost identical to injection-moulded bearings
Determine the service life of 3D-printed plain bearings in your application. Just enter the required parameters in the free Long Life Calculator for plain bearings and have the service life of the bearing calculated. ⯈ To the Long Life Calculator
Test parameters:
- Surface pressure: 1MPa
- Surface speed: 0.3m/s
- Stroke: 5mm
- Running time: 1 week
Shaft materials:
■ CF53 / AISI 1055: Hardened steel
■ 304 SS / AISI 304: Stainless steel
Y-axis: Wear rate [μm/km]
X-axis: Materials in the test
1. ABS (FDM 3D printing)
2. iglidur J260 (FDM 3D printing)
3. iglidur J260 (injection moulding)
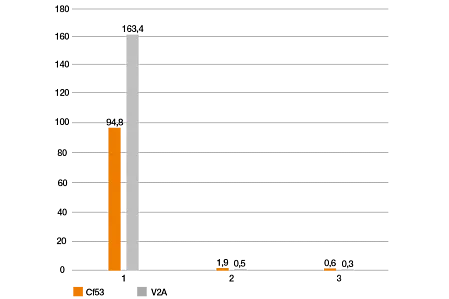
Test result:
The plain bearing made of wear-resistant plastic iglidur J260 has similarly good wear rates, regardless of whether it was manufactured in 3D printing or injection moulding. In the test, iglidur J260 injection moulded plain bearings and 3D-printed bearings were tested with the same load and surface speed.
This test also shows that the friction coefficients and abrasive wear of our iglidur 3D printing materials are many times lower than those of standard ABS materials thanks to the tribological specifications.
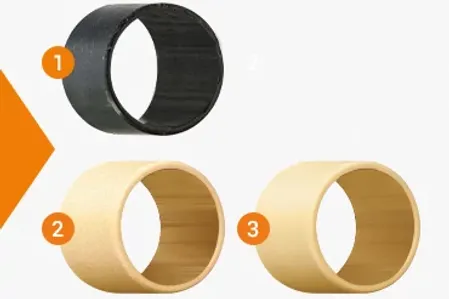
Bearings made of 3D-printed sliding plastics impress due to their significantly longer service life than bearings made from conventional 3D-printed plastics and their wear values that are at least as low as those of machined components.
Test parameters:
- Surface pressure: 1MPa
- Surface speed: 0.1m/s
Shaft materials:
■ CF53 / AISI 1055: Hardened steel
■ 304 SS / AISI 304: Stainless steel
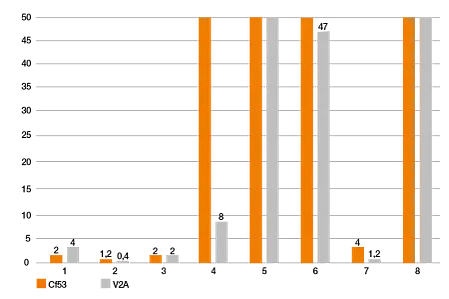
X-axis: Materials in the test
1. iglidur i3 (SLS 3D printing)
2. iglidur i150 (FDM 3D printing)
3. iglidur i190 (FDM 3D printing)
4. PA12 (SLS 3D printing)
5. ABS (FDM 3D printing)
6. PA66 (injection moulding)
7. POM (machined)
8. PA66 (machined)
Wear test: Pivoting
Up to 50 times higher abrasion resistance thanks to iglidur plastic
How long will a 3D-printed iglidur bearing last in your application? Just enter the requirements and determine the service life online with our free Long Life Calculator for plain bearings: ⯈ To the Long Life Calculator
Test parameters:
- Surface pressure: 20MPa
- Surface speed: 0.01m/s
- Pivoting angle: 60°
- Running time: 4 weeks
Shaft materials: 304 SS
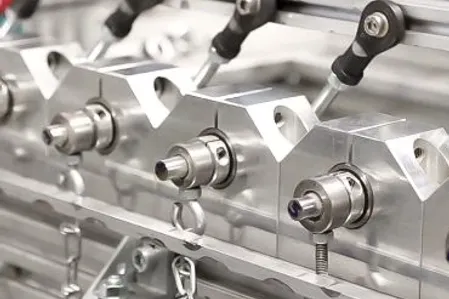
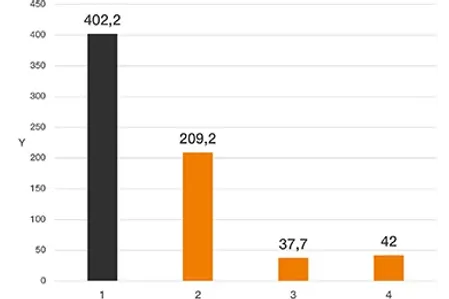
Y-axis: Wear rate [µm/km]
X-axis: Materials in the test
1. PA12 (SLS 3D printing)
2. PA12 + glass beads (SLS 3D printing)
3. iglidur i3 (SLS 3D printing)
4. iglidur W300 (injection moulding)
Test result:
In the pivot test, the tribological specifications of the iglidur materials lead to up to 50 times higher abrasion resistance compared to the standard 3D printing materials (e.g. PA12).
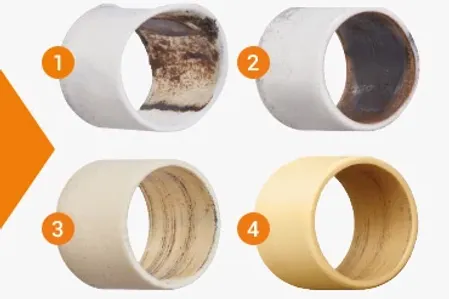
In the swivel test, bearings made of 3D-printed sliding polymers exhibit a service life several times that of other plastics, regardless of the manufacturing process.
Test parameters:
- Surface pressure: 2MPa
- Surface speed: 0.01m/s
- Pivoting angle 60°
Shaft materials:
■ CF53 / AISI 1055: Hardened steel
■ 304 SS / AISI 304: Stainless steel
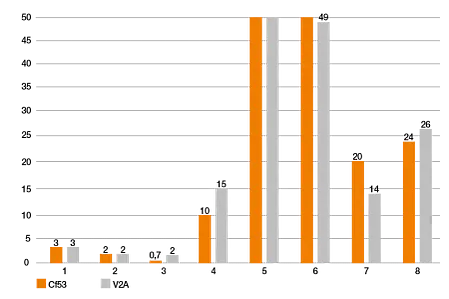
X-axis: Materials in the test
1. iglidur i3 (SLS 3D printing)
2. iglidur i150 (FDM 3D printing)
3. iglidur i190 (FDM 3D printing)
4. PA12 (SLS 3D printing)
5. ABS (FDM 3D printing)
6. PA66 (injection moulding)
7. POM (machined)
8. PA66 (machined)
Wear test: Pivoting heavy load
Comparable tribological specifications for printed and injection moulded bearings
Determine the exact service life of a 3D-printed bearing made of iglidur in your application. Just enter the required parameters in the free Long Life Calculator for plain bearings and calculate the service life online: ⯈ To the Long Life Calculator
Test parameters:
- Surface pressure: 10, 20 and 45MPa
- Surface speed: 0.01m/s
- Pivoting angle: 60°
- Running time: 1 week
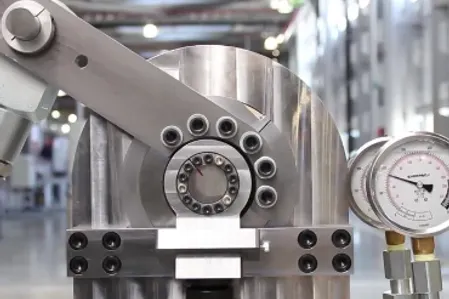
In the test, plain bearings with a diameter and length of 20mm were tested, i.e. a load of 1,800kg was applied to the 3D-printed plain bearing.
Y-axis: Wear rate [µm/km]
X-axis: Materials in the test
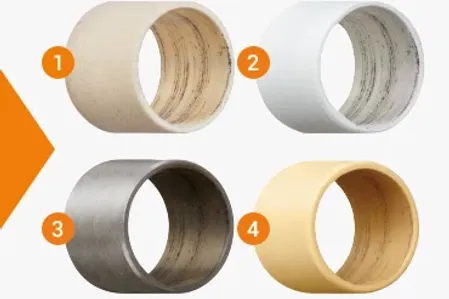
1. iglidur i3 (SLS 3D printing)
2. iglidur i180 (FDM 3D printing)
3. iglidur G (injection moulding)
4. iglidur W300 (injection moulding)
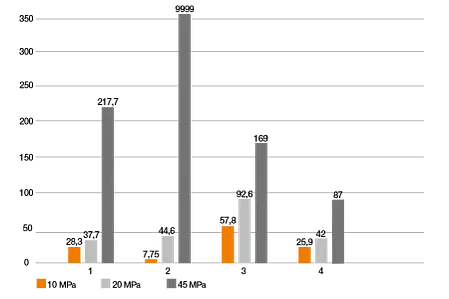
Test result:
This heavy load test shows that 3D-printed plain bearings (SLS process) can be subjected to a surface pressure of up to 45MPa. The abrasive wear is just as good as with plain bearings from injection moulding. Use in high-load applications is therefore possible.
Wear test: Swivelling under water
Comparison of the wear rates of iglidur materials for 3D printing and injection moulding in use under water
Test parameters:
- Surface pressure: 1 and 2MPa
- Surface speed: 0.01m/s
- Temperature: 23°C
Shaft material: 304SS
X-axis: Materials in the test
1. iglidur i3 (SLS 3D printing)
2. iglidur i8-ESD (SLS 3D printing)
3. iglidur J (injection moulding)
4. iglidur UW (injection moulding)
5. iglidur UW160 (injection moulding)
Y-axis: Wear rate [µm/km]
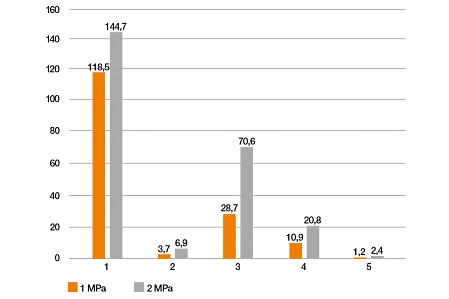
Test result:
This pivot test under water shows that 3D-printed plain bearings made of the [electrostatically dissipative SLS material iglidur i8-ESD](/de-de/website/3d-druck/material/#ESD-taugliche Werkstoffe "fb73e0e2-1130-4a71-97b5-5c0928734375") have a particularly high service life and the material is therefore just as suitable for such applications as the injection moulding materials iglidur UW and UW160, which were specially developed for use under water.
iglidur J is a frequently used igus material in a dry environment, but is not so well suited for use under water due to its rather high wear rate.
Wear test: Drive nut
iglidur materials in 3D printing: Wear-resistant plastics more durable by a factor of 6 to 18 compared to standard materials
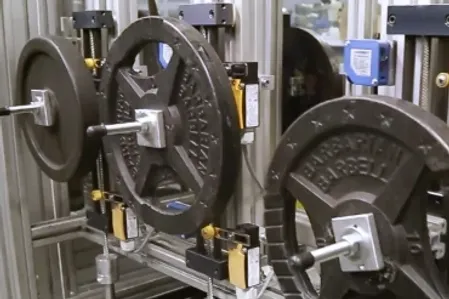
Test parameters:
- Torque: 129Nm
- Stroke: 370mm
- Speed (spindle speed): 290rpm
- Running time: 2 weeks
Y = Wear rate [µm/km]
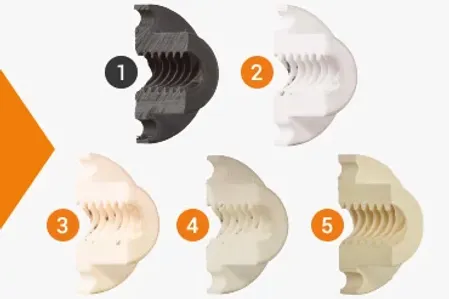
X-axis: Materials in the test
1. ABS (FDM 3D printing)
2. iglidur i180 (FDM 3D printing)
3. iglidur J260 (FDM 3D printing)
4. iglidur i3 (SLS 3D printing)
5. iglidur J (injection moulding)
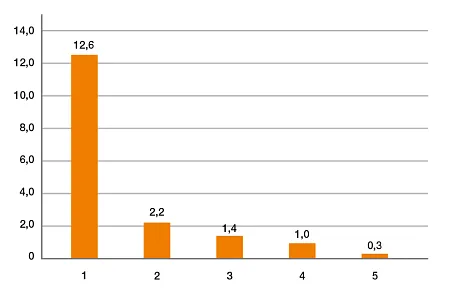
Test result:
In this test, the wear resistance of igus 3D printing materials compared to conventional materials, depending on the 3D printing material and process, is 6 to 18 times
higher. Producing drive nuts using 3D printing offers cost advantages, especially for small quantities, as the thread can be produced directly in 3D printing and no expensive tool is required to cut the thread. All that is required is that the thread is designed in the model.
Friction coefficient test: Rotating
Wear-resistant plastic iglidur and standard ABS material in comparison - lower coefficient of friction with iglidur
Wear-resistant plastics and tribological specifications are helpful in the design of motors or drive forces, since with half the friction only half the drive force is required. With our free Long Life Calculator for plain bearings, you can determine how long a 3D-printed plain bearing made of iglidur will last in your application by specifying your requirements.
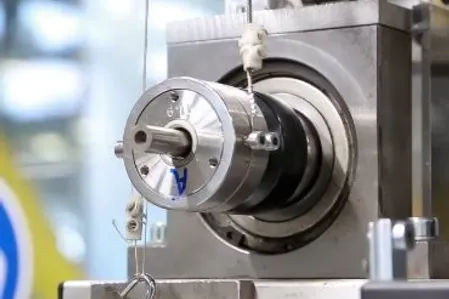
Test parameters:
- Surface pressure: 1MPa
- Surface speed: 0.1m/s
Shaft material: Cf53
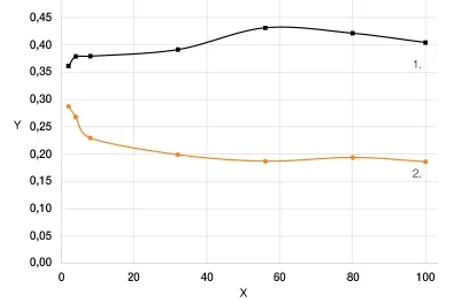
Y = Coefficient of friction [-]
X = Running time [h]
1. PA12 (SLS 3D printing)
2. iglidur i3 (SLS 3D printing)
Test result:
The tribological specifications of iglidur i3 are better in the test by a factor of 2 than with the standard 3D printing materials. This is due to the fact that solid lubricants are integrated in iglidur materials, which reduce the friction values and significantly increase the wear resistance.
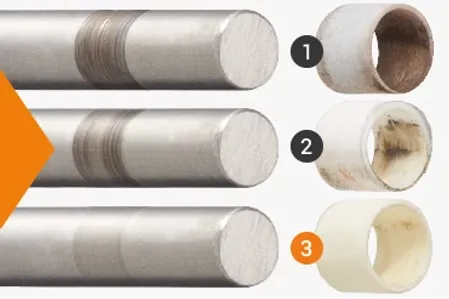
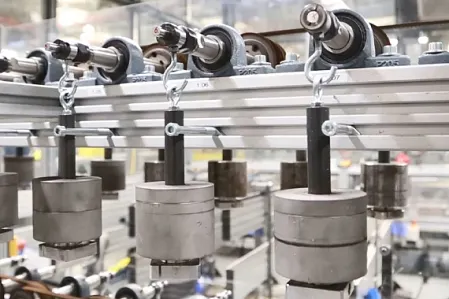
Wear test: Rotating
Wear values of iglidur 3D printing materials in comparison with common 3D printing plastics
How long does a 3D-printed bearing made of iglidur last in your application? Use our Long Life Calculator for plain bearings to precisely determine the service life by specifying the necessary requirements.
Test parameters:
- Surface pressure: 20 MPa
- Surface speed: 0.01 m/s
Shaft material: 304 SS
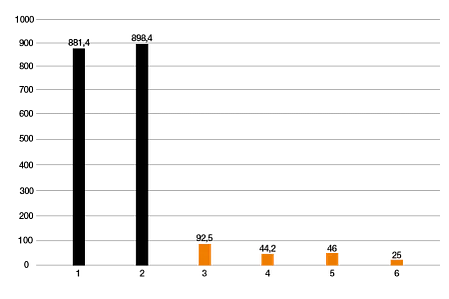
Y-axis: Wear rate [µm/km]
X-axis: Materials in the test
1. ABS (FDM 3D printing)
2. PA12 (SLS 3D printing)
3. iglidur i180 (FDM 3D printing)
4. iglidur J260 (FDM 3D printing)
5. iglidur i3 (SLS 3D printing)
6. iglidur W300 (injection moulding)
Test result:
The wear of printed plain bearings made from iglidur i180 is 89.5% lower than that of bearings made from the frequently used ABS plastic in the same process. The sintered bearing made of iglidur i3 proved to have 94.87% less wear than the sintered bearing made of PA12. Only the bearing made of the special filament iglidur J260 and the bearing manufactured in injection moulding from iglidur W300 exhibited better values.
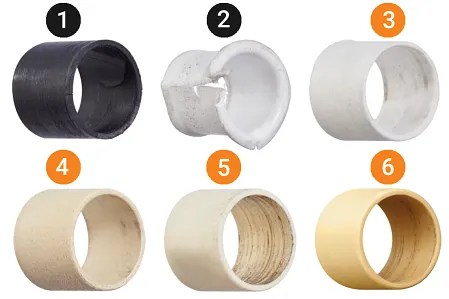
In the rotation test, bearings made of 3D-printed sliding polymer perform much better than bearings made of regular plastics, regardless of the manufacturing process.
Test parameters:
- Surface pressure: 1MPa
- Surface speed: 0.3m/s
Shaft materials:
■ CF53 / AISI 1055: Hardened steel
■ 304 SS / AISI 304: Stainless steel
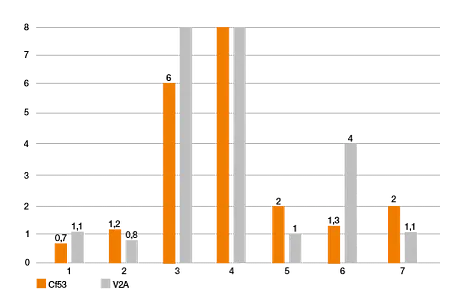
X-axis: Materials in the test
1. iglidur i3 (SLS 3D printing)
2. iglidur i190 (FDM 3D printing)
3. PA12 (SLS 3D printing)
4. ABS (FDM 3D printing)
5. PA66 (injection moulding)
6. POM (machined)
7. PA66 (machined)
Wear test: Rotating under water
Comparison of the wear rates of iglidur materials for 3D printing and injection moulding in use under water
Test parameters:
- Surface pressure: 1 and 2MPa
- Surface speed: 0.3m/s
- Temperature: 23°C
Shaft material: 304SS
X-axis: Materials in the test
1. iglidur i3 (SLS 3D printing)
2. iglidur i8-ESD (SLS 3D printing)
3. iglidur J (injection moulding)
4. iglidur UW (injection moulding)
5. iglidur UW160 (injection moulding)
Y-axis: Wear rate [µm/km]
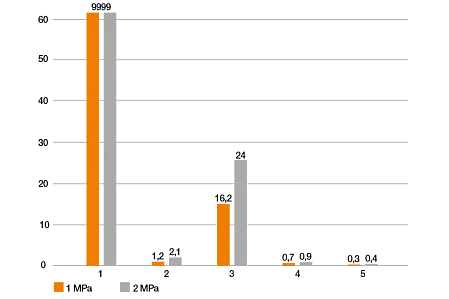
Test result:
The rotation test under water shows that 3D-printed plain bearings made of the [electrostatically dissipative SLS material iglidur i8-ESD](/de-de/website/3d-druck/material/#ESD-taugliche Werkstoffe "fb73e0e2-1130-4a71-97b5-5c0928734375") have a particularly high service life and the material is therefore just as suitable for such applications as the injection moulding materials iglidur UW and UW160, which were specially developed for use under water.
iglidur J is a frequently used igus material in a dry environment, but is not so well suited for use under water due to its rather high wear rate.
Test for UV and weather resistance
Comparison of the change in strength of iglidur materials for 3D printing and injection moulding
Test conditions:
- ASTM G154 cycle: Simulation of weathering and UV light
- Duration: 2,000 hours
X-axis: Materials in the test
1. iglidur i8-ESD (SLS 3D printing)
2. iglidur i3 (SLS 3D printing)
3. iglidur i6 (SLS 3D printing)
4. iglidur J (injection moulding)
5. iglidur G (injection moulding)
Y-axis: percentage change in strength
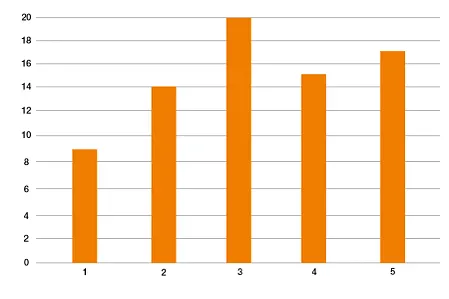
Test result: SLS materials are in no way inferior to injection moulding materials
After the bending test specimens were exposed to moisture and UV light for 2,000 hours in the test, it was shown that the iglidur materials for selective laser sintering exhibit a similar change in strength as the most frequently used injection moulding materials iglidur J and G. The SLS material iglidur i8-ESD is the most resistant to weathering and UV light. This test makes it clear that the iglidur 3D printing materials are in no way inferior to the injection moulding materials in terms of UV and weather resistance.
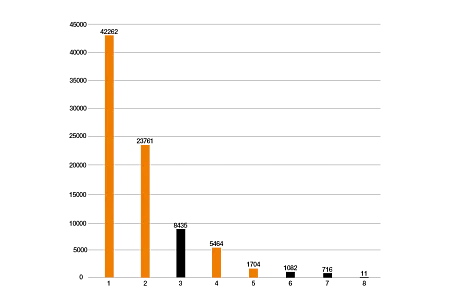
Gear test: Cycles until gear breaks
Test parameters:
Pivoting 1440°:
n = 64rpm
M = 2.25Nm
z = 30
m = 1
b = 6mm
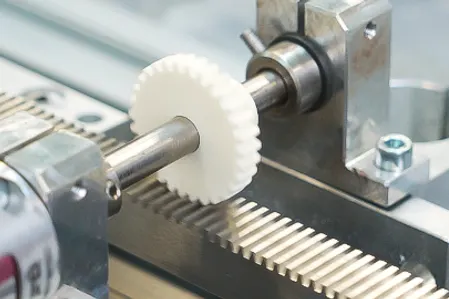
In this test, a gear rack is driven with a gear and the number of cycles after which the gear breaks if measured. It can be seen that the iglidur gears produced by 3D printing or laser sintering last twice as long in the test as milled gears made of POM.
X-axis: Materials in the test
1. iglidur i3 (printed)
2. iglidur i8-ESD (printed)
3. POM (milled)
4. iglidur i6 (printed)
5. iglidur i190 (printed)
6. PLA (printed)
7. PETG (printed)
8. SLA
With the exception of the gear made of POM, the CAD models of all tested gears originate from the igus gear configurator.
Extremely long service life of worm gears with optimised sliding properties
Test parameters:
- Torque: 4.9Nm
- Speed: 12rpm
- Mating partner: Anodised aluminium
- Running time: 2 months
Evaluation:
► POM (milled): Total failure after 621,000 cycles
► iglidur i6 (sintered): Low wear after 1 million cycles
Low abrasive wear due to tribology plastics from the 3D printer
Consulting
I look forward to answering your questions

Online:
24h